Plot Projects proudly presents two new features in our dashboard: a real time Event Map and Heatmap. Login to our dashboard to see your real time location analytics. If you do not yet have an account, now is the time to create one.
Real Time Event Map
Watch your notifications appear on the map as your users receive and open them!
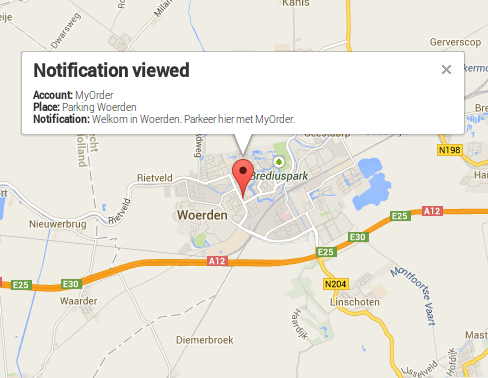
Notifications Sent and Viewed
Real Time Heatmap
Watch the distribution of your users across The Netherlands. Other regions will be added soon. Add your suggestions for different regions as comments (e.g. entire world, Europe, North America)!
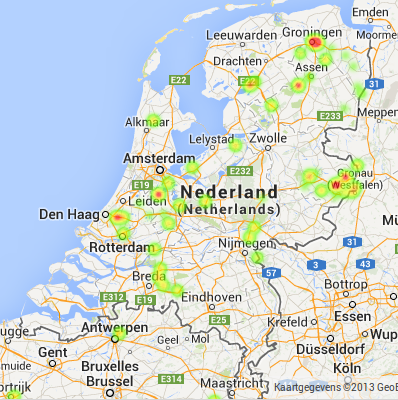
Real Time Heatmap of Your User Distribution