This blog post refers to version 1.x of the plugin.
For version 2.x please refer to the integration guide
With the new release we have added a convenience method to send the debug log the Plot Plugin generates. While we have already written about testing the integration on Android and iOS in two blog posts, in this post we want to explain logging a bit more in general and how this new feature can help you see how the Plot Plugin works in the background.
Test Receiving of Notifications
Let’s start with the basics, in order to test the integration of the Plot Plugin, make sure you have created a Geofence on your current location and attached a notification to that Geofence. You can do this on our dashboard. When you have received that notification, you can be sure that notifications can be received.
The Plot Plugin tries to update its database regularly in the background. Therefore when a new notification has been added it may take a couple of hours before that notification is downloaded and may be received by the user. To make testing easier, you can re-install your app and open it to force an update, triggering the notification on your location again.
Debugging
The Plot Plugin provides a debug log containing messages that help you diagnose situations where no notification is shown. For example, it helps you distinguishing between situations where the plugin thinks it is not close enough to a location or whether the notification filter dropped the notification.
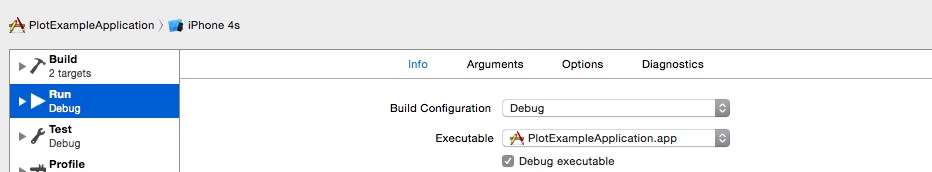
To enable the debug logging you will have to compile your app with the debug flag on, for iOS this can be done as a build configuration in Xcode (Product -> Scheme -> Edit Scheme…). This is the default setting when pressing run.
For debugging in Android, you will have to add the snippet below to the Android manifest xml (found in your project root).
<service android:name="com.plotprojects.retail.android.PlotBackgroundService">
    <meta-data android:name="debug" android:value="true" />
</service>
Sending the Debug Log
In order to view your debug log you can plug your device unto your machine as described in the previous posts, but with the recently released feature you can now read it from anywhere! All you have to do is call [PlotDebug mailDebugLog:self] for iOS or Plot.mailDebugLog() on Android in your app, for instance after a button click event. The method will call your email client so you can send the debug log to yourself (or your nearest developer). An example of this can be seen in our demo apps, which you can download from our dashboard.
Reading the Debug Log
What does the Plot Plugin log tell you? Everything you need to know! When logging to directly to your computer our log messages have a generic format, each message starts with a timestamp of the event, then a log level (for instance, DEBUG or INFO) and the message. For example the message below tells you that Plot has been enabled and it received 58 notifications (in its local database).
24 Nov 2014 17:44:14 DEBUG Enabling Plot Plugin.
24 Nov 2014 17:45:52 DEBUG Received 58 notifications.
We try to write our log messages as informative as possible, so they should be clear enough when you read them. They might differ slightly between Android and iOS because of technical differences between the two platforms.
Further Information
For more information, check out our documentation and library references for Android and iOS.
Remember to turn off debug mode when releasing!